Fishbone diagrams in Mindmup
You can create fishbone diagrams in Mindmup to explore cause-and-effect relationships and identify the root causes of a problem. Fishbone diagrams—also known as Ishikawa diagrams—are shaped like a fish skeleton, with the “head” representing the problem and the “bones” representing categories such as people, processes, or equipment.
Causes are added along each bone and can branch into sub-causes. This makes fishbone diagrams especially useful for structured brainstorming, root cause analysis, and breaking down complex issues in a clear, visual way.
All the usual keyboard shortcuts and productivity features in Mindmup work the same way in fishbone diagrams, so you can brainstorm and collaborate efficiently without changing your workflow.
Create or switch to a fishbone diagram
You can create a new fishbone diagram or convert an existing map into a fishbone layout at any time.
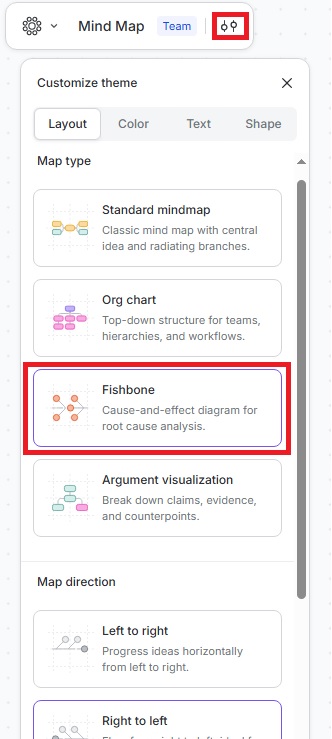
- Click the Customize theme icon in the top-left menu of your map.
- Go to Layout › Fishbone.
- Select the map direction:
- Left to right
- Right to left
Mindmup will create a new fishbone map or update your existing map using the selected layout.
Fishbone diagrams already tend to include a lot of text, and adding extra visual elements can make them harder to read. For clarity, we recommend placing explanations and details directly inside the node text.
If you have questions or feedback, contact us at contact@mindmup.com.